Charts - Chart types
You set the chart type in the Main tab of the ribbon menu of the chart window.
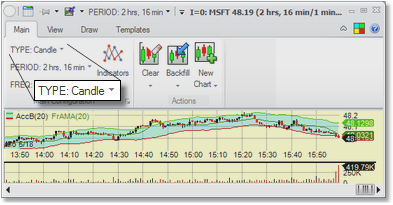
The available chart types are:
Time-based Chart Types (with continuous bottom time axis) |
||
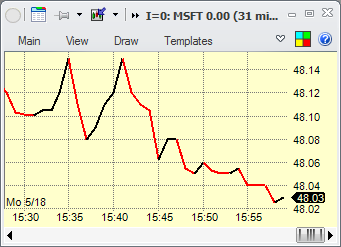
•Line - a line graph that shows the Close value for every time period. Line segments that slope upwards have positive color, segments that slope downwards have negative color. As you see some detail is lost but it is not as busy as the Line Tick type.
The time period that each line segment covers is specified in the chart's Frequency.
|
Example Line Chart
|
|
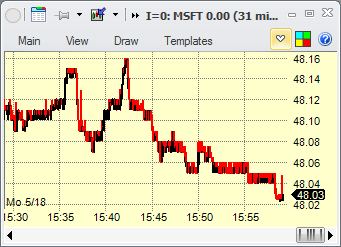
•Line Tick - a line graph that shows every tick for the symbol - that is, every time a trade occurs, a new point on the graph is added. Line segments that slope upwards have positive color, segments that slope downwards have negative color.
This chart type is only as good as the data for the symbol that is available. For example, if you backfill the data from a source that only gives 1-minute cumulative data, the chart will not show you the detail you'd expect from Line Tick charts... |
Example Line Tick Chart
|
|
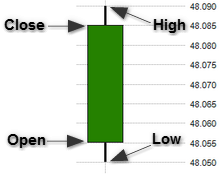
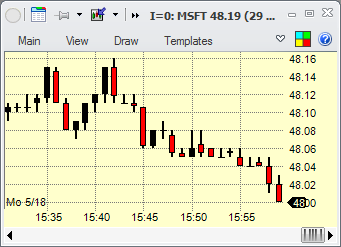
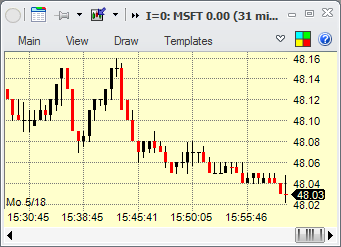
•Candle - each candle shows the Open, High, Low and Close values for a time period. The color of the candle indicates where the Open and Close values are. If the candle has the positive color (in this case Green), the Open is less than Close. For a negative candle, the Open is greater than Close.
The time period that each candle covers is specified in the chart's Frequency.
|
Example Candle Chart
|
|
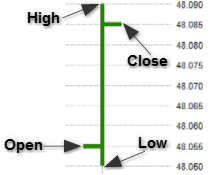
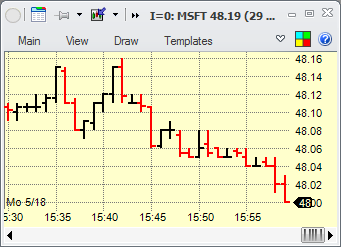
•OHLC - each bar shows the Open, High, Low and Close values for a time period. The color of the bar indicates where the Open and Close values are. If the bar has the positive color (in this case Green), the Open is less than Close. For a negative bar, the Open is greater than Close.
The time period that each candle covers is specified in the chart's Frequency. |
Example OHLC Chart
|
|
Non-time-based Chart Types (with discrete bottom time axis) |
||
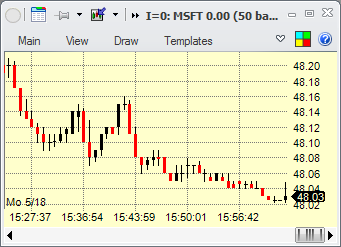
•Tick Candle and Tick OHLC - each candle or bar shows the Open, High, Low and Close for a certain number of ticks - that is, trades.
The number of trades in each candle or bar is specified in the chart's Frequency. Note that this chart type is only useful if the data that you have for the symbol is true tick data. |
Example Tick Candle Chart
|
|
•Volume Candle and Volume OHLC - each candle or bar shows the Open, High, Low and Close for a certain volume of shares traded.
The volume associated with each candle or bar is specified in the chart's Frequency. |
Example Volume Candle Chart
|
|
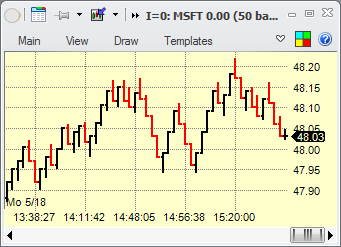
•Range Candle and Range OHLC - each candle or bar shows the Open, High, Low and Close for a certain range of price movement. Because of that, each candle or bar are of exactly same height (except for the rightmost candle or bar that is being built).
The range for each candle or bar is specified in the chart's Frequency. |
Example Range OHLC Chart
|
|
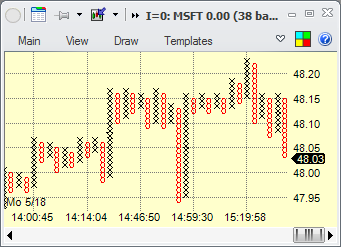
•Point & Figure - chart type that emphasizes the trend. If you're interested in this chart type, some introductory explanations can be found here.
Instead of Frequency, this type of chart has Box Size and Reversal parameters.
If you choose Box Size of 1, an opetion of One Box Combine is provided. That combines one-box columns with the subsequent column in order to make a more compact chart display. |
Example Point & Figure Chart
|
|
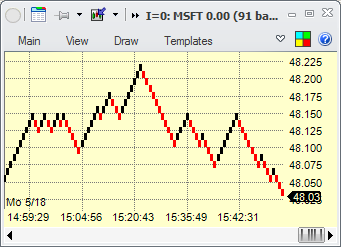
•Renko - chart type popular in Japan that attempts to filter out small price movements. If you're interested in this chart type, some introductory explanations can be found here.
Instead of Frequency, this type of chart has Box Size and Reversal parameters. |
Example Renko Chart
|
|
All of the above types are available for intraday charts. Historical charts are only available in the following types:
•Line •Candle •OHLC |
•Point & Figure •Renko |
For all Candle or OHLC charts, the following modifications are possible:
•Heiken Ashi - See discussion here.
•Staircase - Removes the gaps between candles by making the Close of the candle always equal to the next candle's open.
Also, for historical charts, the following modification is available:
•Logarithmic Scale - can be applied to all chart types, changes how the Y scale is calculated and displayed.

